Project Summary
Southern Hemisphere westerly winds and pressure influence numerous important processes, including ice melt in Antarctica and how much carbon the oceans absorb. Most climate observations in Antarctica started only ~40 years ago (~1979), making it very difficult to contextualize recent activity and project future changes in Antarctica.
In O'Connor et al., 2021a, we use data assimilation to produce a reconstruction of winds, pressure, and temperatures in the Southern Hemisphere over the full 20th century. We do this by combining data from a global database of paleoclimate proxy records (such as ice cores, corals, and tree rings) with physical relationships captured in climate model simulations.
In O'Connor et al., 2021a, we use data assimilation to produce a reconstruction of winds, pressure, and temperatures in the Southern Hemisphere over the full 20th century. We do this by combining data from a global database of paleoclimate proxy records (such as ice cores, corals, and tree rings) with physical relationships captured in climate model simulations.
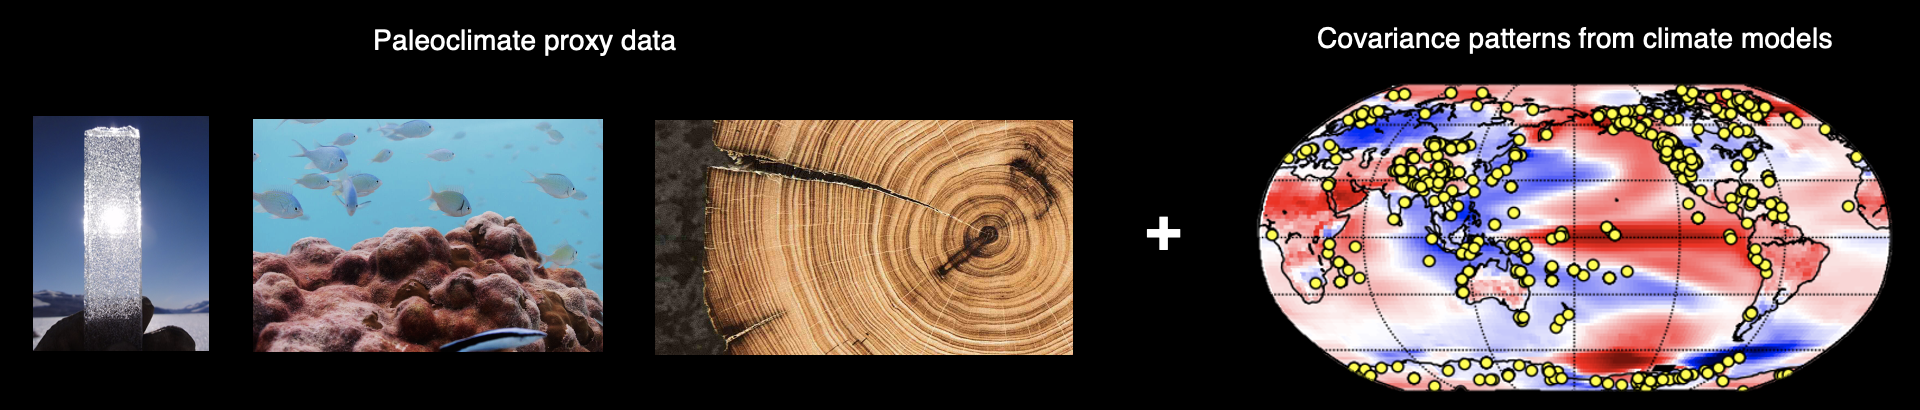
Above: a schematic of data assimilation. The figure on the right show covariances between winds in West Antarctica and global temperatures, as captured by a climate model. Red and blue regions reflect regions with climate the covary with West Antarctic winds. The yellow dots show locations of proxy data.
Major findings from our study:
- Proxy data assimilation yields reliable reconstructions of atmospheric circulation around many key regions of the Southern Hemisphere over the 20th century (see Figure 1 in our paper for a spatial map of skill)
- We tested the sensitivity of the results to the use of 4 different climate models as the data assimilation prior
- Trends and variability in certain regions are sensitive to the choice of climate model
- Including anthropogenic forcing in the climate model prior makes a big difference in some regions, such as the Amundsen Sea sector near West Antarctica
- The circumpolar westerly winds have strengthened throughout the 20th century, especially in the Pacific sector around West Antarctica (see Figure 4 in our paper for a spatial map of trends).
- There is a robust trend toward low pressures in the Amundsen Sea region near West Antarctica
Read O'Connor et al., 2021a in Geophysical Research Letters
|
Download the reconstruction data
All reconstruction data published in O'Connor et al., 2021a are available for download as netCDF files on Zenodo.
Feel free to contact me at [email protected] for questions or collaborations!
Feel free to contact me at [email protected] for questions or collaborations!
|
